Results Summary
Survey Results
Below results were collected in November 2002 from 45 responses received from the Retirement Survey. To view later, cumulative results through January 2004, go view Survey Results 02. Note that this second set of results was included in my Retire and Travel - 20 Years Later book, which I first offered for sale in early 2004. The final results, as of March 2006, are available at Survey Results 03.
The primary intents of the survey were to learn what dollar amount was considered to be adequate for retirement, what amount of monthly income was estimated to be required, and whether people plan to remain employed to some extent after retirement. I also hoped to compare answers from those already retired to those of people not yet retired. I've presented the results below in graphic form, comparing most everything that I thought would be of interest to anyone.
There were three categories in the survey: 1) People not yet retired, 2) People already retired, and 3) People who had retired and were now unretired. As it turns out, the responses in category 3 thus far have been so few that not many reasonable conclusions can yet be drawn in that area, so the majority of results below pertain to categories 1 and 2.
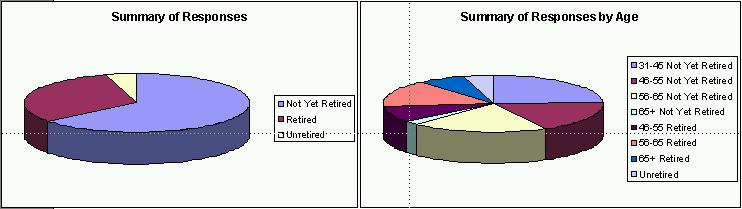
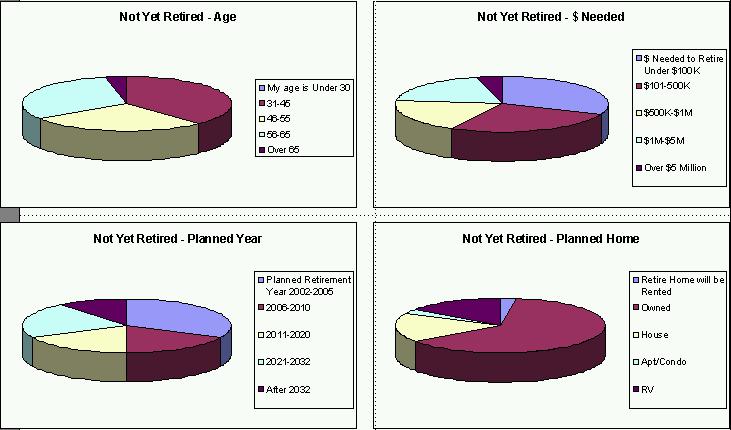
My first surprise was when I realized that 65% of those responding to the survey were not yet retired and that 24% of the respondees were in the 31-45 age group. I had generally assumed that my website would be most interesting to those who were already retired or about to retire.
I've included all pertinent results below. To summarize:
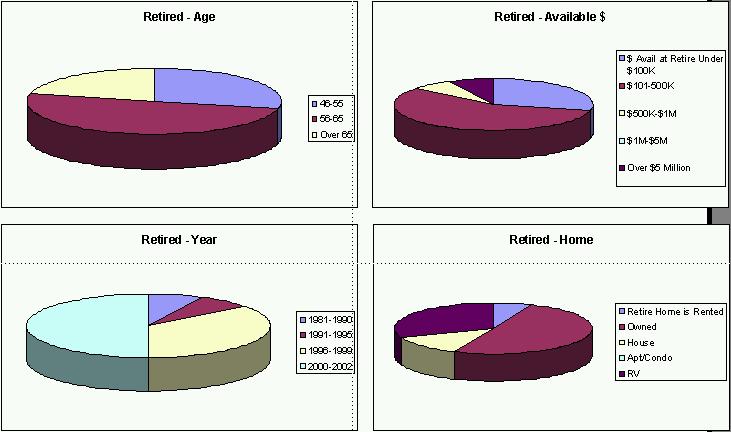
a) Almost nobody, retired or not yet retired, plans to rent their home in retirement.
b) Of retired people who responded, 29% retired with less than $100k and 57% with $101k-$500k.
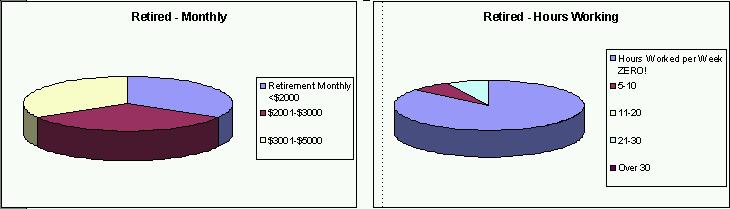
c) Roughly 1/3 of the retirees live on less than $2000 per month, 1/3 on $2001-$3000, and 1/3 on $3001-$5000.
d) 86% of the retirees work ZERO hours per week.
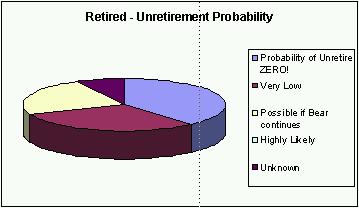
e) 69% view the probability of unretiring to be ZERO or very low.
f) Roughly 1/3 of the "not-yet-retired" respondees are 31-45, 1/3 are 46-55, and 1/3 are 56-65.
g) Of those, 50% plan to retire in the next 7 years.
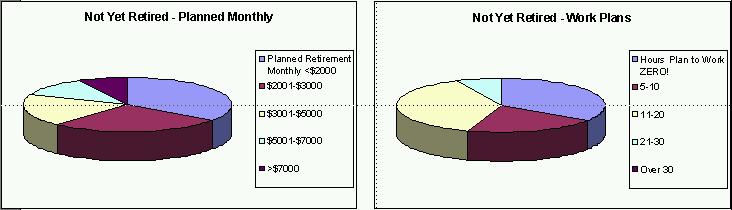
h) 34% of them plan to work ZERO hours after retirement, but 45% expect to work over 10 hours per week.
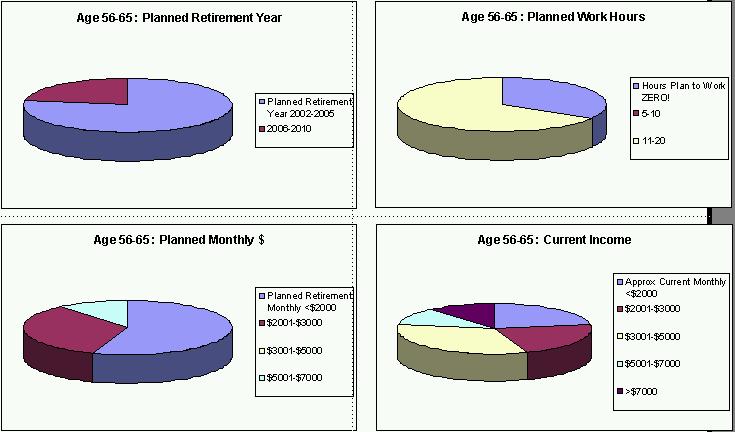
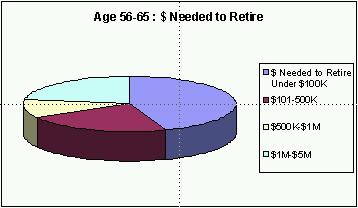
i) In the 56-65 age group, 31% plan to retire with less than $100K and 27% with $101k-$500k; 34% plan to work ZERO hours per week, 21% plan 5-10 hours, and 45% plan 11 or more hours per week. Although one might expect correlation between those planning to retire with less and work more, that wasn't the case -- for example, 50% of those retiring with less than $100k also plan to work ZERO hours.
Charts below are grouped by Retired, Not Yet Retired, Age 31-45 Not Yet Retired, Age 46-55 Not Yet Retired, and Age 56-65 Not Yet Retired.
Results from Retired People
Results from Not Yet Retired People
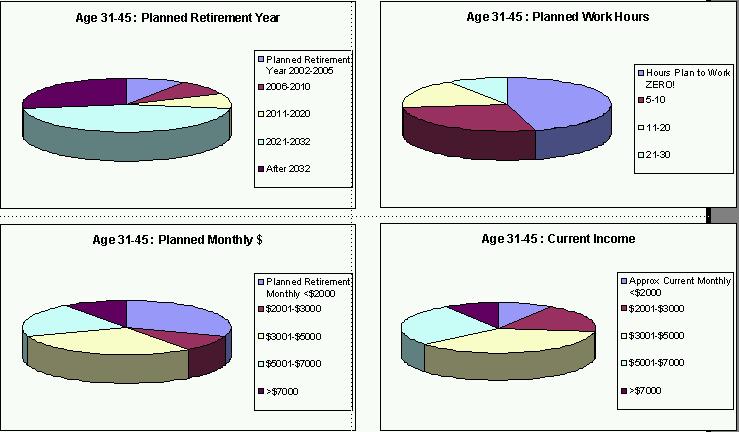
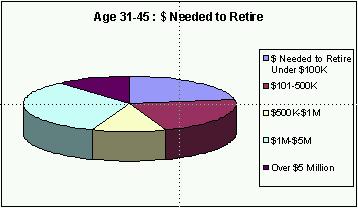
Results from Not Yet Retired People in the 31-45 Age Group
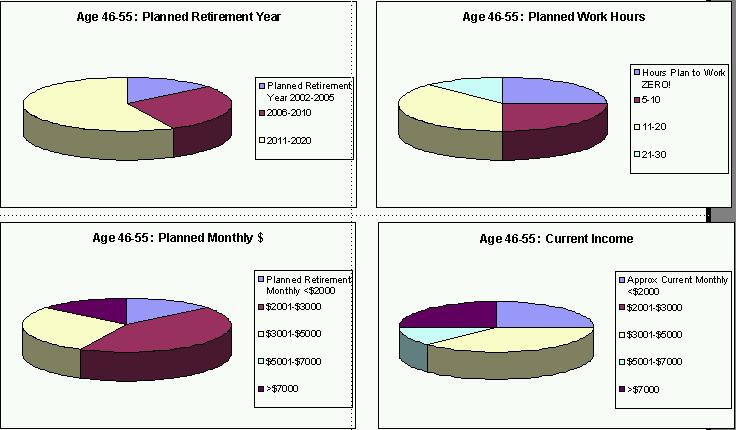
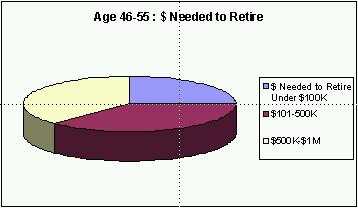
Results from Not Yet Retired People in the 46-55 Age Group
Results from Not Yet Retired People in the 56-65 Age Group
Charts below are grouped by Retired, Not Yet Retired, Age 31-45 Not Yet Retired, Age 46-55 Not Yet Retired, and Age 56-65 Not Yet Retired.
You're Visitor #
 | ||||||
Nothing in this site is copyrighted -- I'd be honored if you'd reuse anything you find here for your website