| ||||||
Results Summary #3 (Representing 41 months of data-gathering)
Survey Results #3
I initially set up the Retirement Survey in November 2002, published the first set of results at the end of November 2002, then the second set in January 2004, and now these final results.
To continue, here are the results as of March 2006:
Let me give you the answer first: In survey results #2, I gave some general characterizations of my average visitor, how much they thought they needed to retire, when they'd retire, etc. This time around, I'll provide you with the data and you can gather your own conclusions. About the only thing that stands out is that the younger (31-45) crowd seems to be leaning toward thinking they can retire earlier for less money, while the older (46-65) crowd has started thinking they'll work longer and need more. Who knows?
NOTE: In the charts below, I've presented the graphs based upon results gathered from November 2002 - March 2006, "underlayed" with the charts from November 2002 - January 2004. To view the "underlay", simply mouse over the graphic. I thought this would make it easier to compare. The underlayed graphics are the ones that were included in Survey Results #2.
Now read on for details:
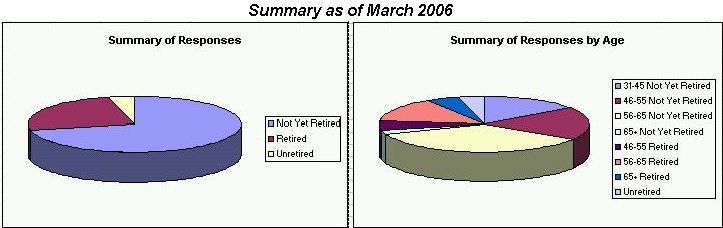
Below results were collected during 2002-2006 from responses received from the Retirement Survey . Charts are grouped by Retired, Not Yet Retired, Age 31-45 Not Yet Retired, Age 46-55 Not Yet Retired, and Age 56-65 Not Yet Retired. To view earlier results as of November 2002, go to the original Survey Results page. To view those through January 2004, go to Survey Results #2. The results below include those from the earlier results pages (i.e., they're cumulative).
The primary intents of the survey were to learn: 1) what dollar amount was considered to be adequate for retirement, 2) what amount of monthly income was estimated to be required, and 3) whether people plan to remain employed to some extent after retirement. I also hoped to compare answers from those already retired to those of people not yet retired. I've presented the results below in graphic form, comparing most everything that I thought would be of interest to anyone.
There were three categories in the survey: a) People not yet retired, b) People already retired, and c) People who had retired and were now unretired. As it turns out, the responses in category c were so few that not many reasonable conclusions could be drawn in that area, so the majority of results below pertain to categories a and b. Also, a note to the few under-30 persons and over-65 that took the survey -- since you were so few, I've grouped under-30 with the 31-45 age group and over-65 with the 56-65 group -- hope you don't mind.
Differences between these and the previous results:
Simply mouse-over any graphic to see January 2004 results.
You're Visitor #
Nothing in this site is copyrighted -- I'd be honored if you'd reuse anything you find here for your website

Below are all the details, so you can draw your own conclusions about the results. Charts are grouped by Retired, Not Yet Retired, Age 31-45 Not Yet Retired, Age 46-55 Not Yet Retired, and Age 56-65 Not Yet Retired. If you spend time reviewing these and notice any significant trends that I've overlooked, I'd appreciate an email at rjhoffman@yahoo.com.
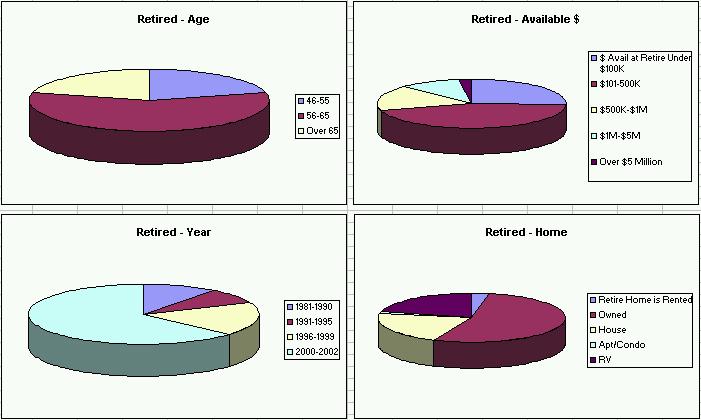
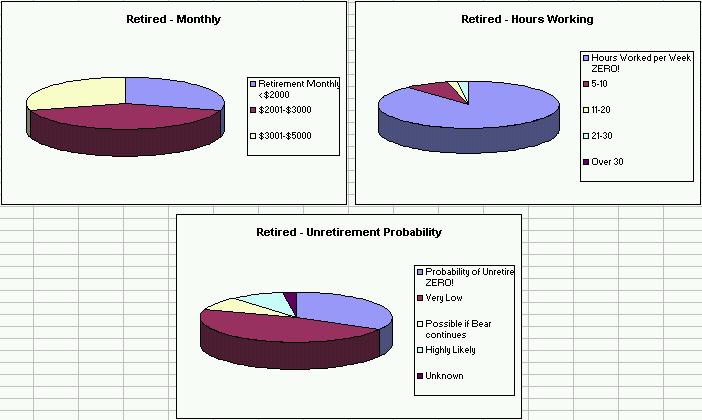
Results from Retired People
Simply mouse-over any graphic to see January 2004 results
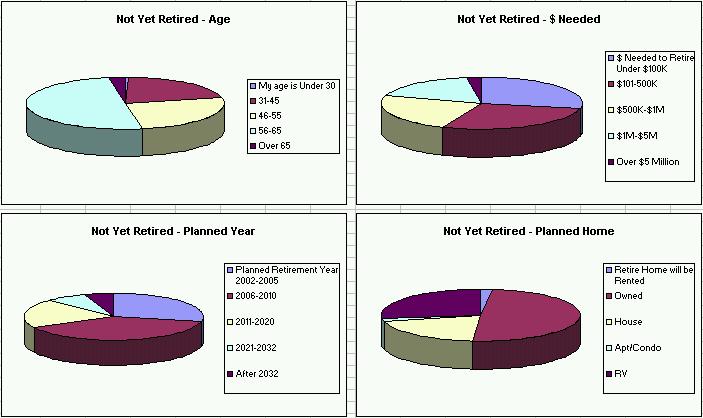
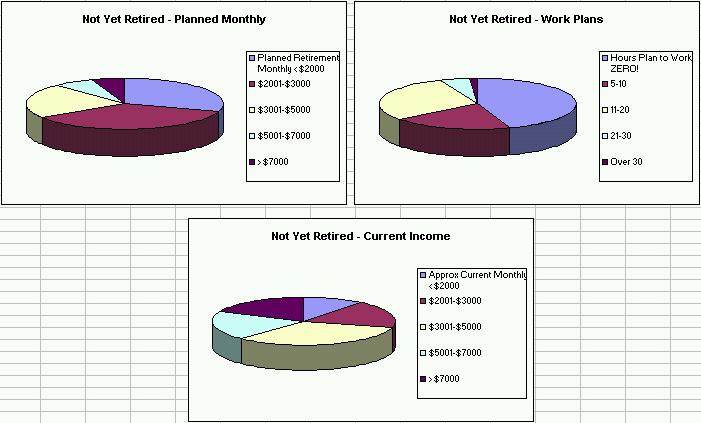
Results from Not Yet Retired People
Simply mouse-over any graphic to see January 2004 results
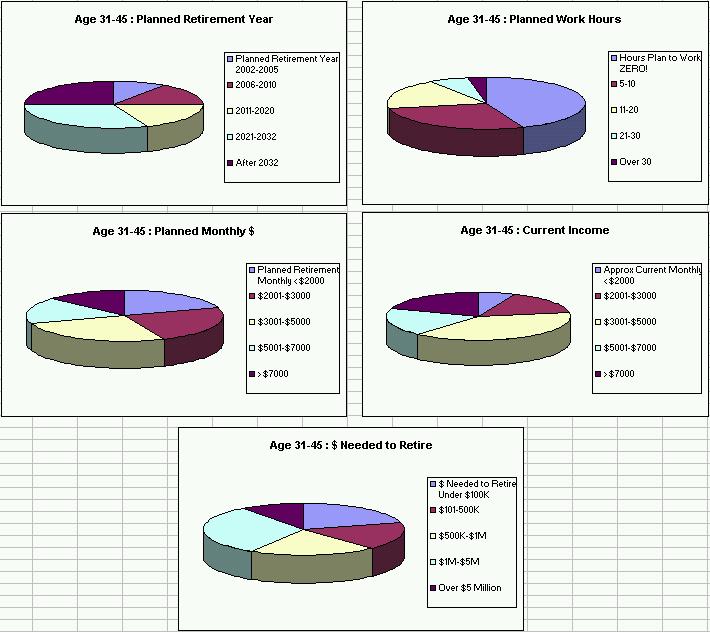
Results from Not Yet Retired People in the 31-45 Age Group
Simply mouse-over any graphic to see January 2004 results
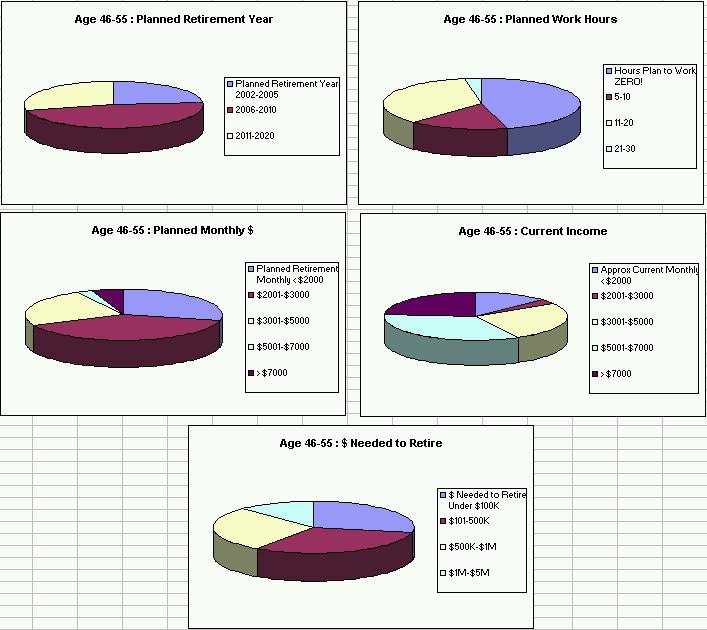
Results from Not Yet Retired People in the 46-55 Age Group
Simply mouse-over any graphic to see January 2004 results
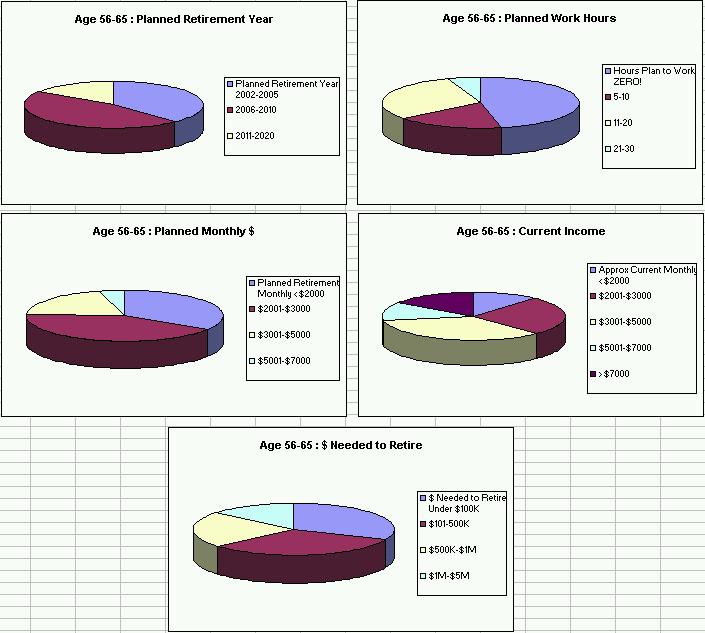
Results from Not Yet Retired People in the 56-65 Age Group
Simply mouse-over any graphic to see January 2004 results