Results Summary #2
Survey Results #2
I initially set up the Retirement Survey in November 2002, published the first set of results at the end of November 2002, then these in January 2004. The final results, as of March 2006, are available at Survey Results 03.
To continue, here are the results as of January 2004:
Let me give you the answer first: If you're the "average" visitor to my website (i.e., currently earning about $3000-$5000 per month), you're expecting to retire in the next 6 years, planning to own your own home (which will be an RV), have $100-500k, spend around $3000 per month, and work up to 20 hours a week doing something very different from your current occupation. This, despite the fact that 84% of the already-retired contributors to the survey say that they don't work, and those that do are working in the same field that they retired from.
Now read on to see what made me conclude this.
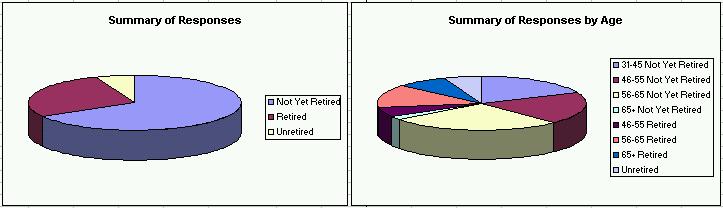
Below results were collected during 2002-2003 from responses received from the Retirement Survey . Charts are grouped by Retired, Not Yet Retired, Age 31-45 Not Yet Retired, Age 46-55 Not Yet Retired, and Age 56-65 Not Yet Retired. To view earlier results as of November 2002, go to the original Survey Results page. The results below include those from the earlier results page (i.e., they're cumulative).
The primary intents of the survey were to learn: 1) what dollar amount was considered to be adequate for retirement, 2) what amount of monthly income was estimated to be required, and 3) whether people plan to remain employed to some extent after retirement. I also hoped to compare answers from those already retired to those of people not yet retired. I've presented the results below in graphic form, comparing most everything that I thought would be of interest to anyone.
There were three categories in the survey: a) People not yet retired, b) People already retired, and c) People who had retired and were now unretired. As it turns out, the responses in category c were so few that not many reasonable conclusions could be drawn in that area, so the majority of results below pertain to categories a and b. Also, a note to the one under-30 person that took the survey -- since you were the only one, I've grouped you in with the 31-45 age group -- hope you don't mind.
Differences between these and the previous results: I'm not really sure how important this difference is, but decided to include the information here to keep you readers from having to jump back and forth between the two pages to see what the differences might be. In each place that I put a percentage below, I'll include the value from the previous results in (italicized parentheses).
I noticed that in both sets of data, about half of the responses were from people under 55 and half over 55. The cumulative percentages were 46% (53%) under 55 and 54% (47%) over 55. Not sure what this means, but it's encouraging to me to see that number of non-seniors interested in the survey. I guess that shows that a significant number of people are starting to worry about retirement prior to age 55, which is certainly a worthwhile idea. Of those not yet retired, 38% (42%) are under 55.
I was originally surprised when I realized that 64% (65%) of those responding to the survey are not yet retired, 18% (24%) of those are in the 31-45 age group, and 66% (50%) plan to retire before 2010. I had generally assumed that my website would be most interesting to those who were already retired or about to retire. After pondering this awhile, however, I realized that this indicates that people are using the website to get tips on retirement while they're still not yet retired, which is of course my intent in putting all this information out here. The fact that roughly 1/5 of them are under 45 is also a good sign, since it means that they're worrying about it early enough to do something about it.
Just for grins, I compared these results to those of the original mini-survey that I had on the Retirement Tips and RV Stuff home page. Based upon the 383 votes received from November 2002 through October 2003, 68% are not yet retired. In addition, 77% of those are planning to retire before 2010. These data represent about 4 times the number that responded to the big survey, but are still in the same range, so I guess I feel confident that my numbers below are fairly accurate. So about 2/3 of my audience aren't retired and 2/3 of those are planning to take the plunge by 2010. With this audience, I think the three questions I mentioned above are the right ones to try to answer here.
You're Visitor #
 | ||||||
Nothing in this site is copyrighted -- I'd be honored if you'd reuse anything you find here for your website

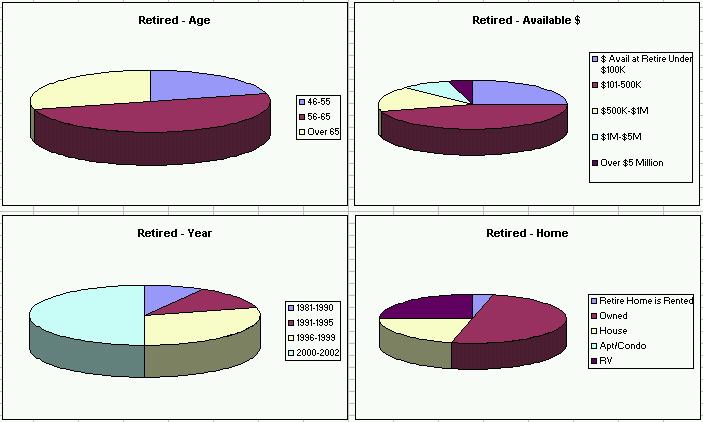
I've included all pertinent results below. To summarize, of the retired people:
a) almost all own their own home and there are slightly more in RVs than in houses.
b) 25% (29%) retired with less than $100k, 46% (57%) with $101k-$500k, and 29% (14%) with more than $500k.
c) 28% (34%) live on less than $2000 per month, 33% (33%) on $2001-$3000, and 39% (33%) on $3001-$5000.
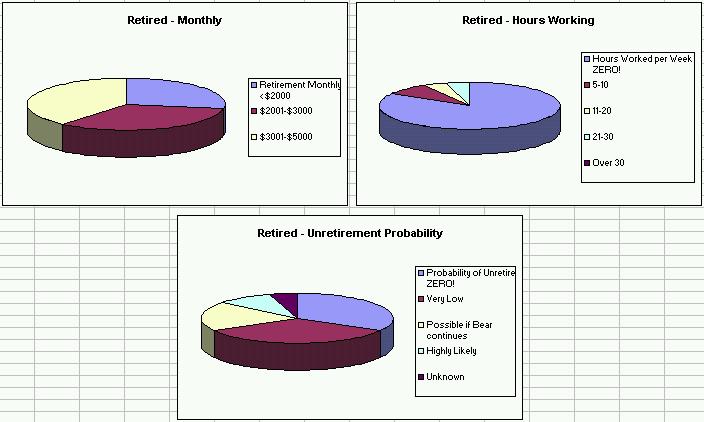
d) 84% (86%) work ZERO hours per week and only 8% (7%) work over 10 hours per week.
e) 66% (69%) view the probability of unretiring to be ZERO or very low.
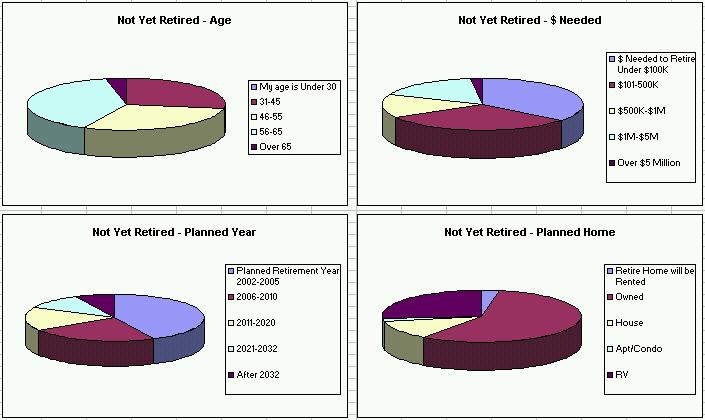
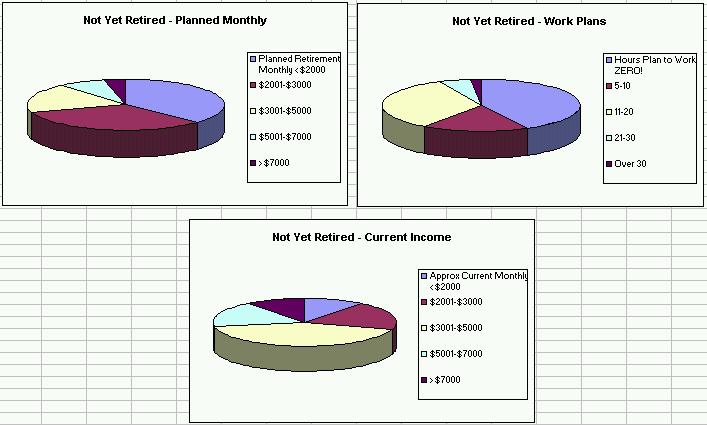
Of the not yet retired:
a) almost all plan to own their own home and many more plan to live in RVs than in houses.
b) 35% (31%) plan to retire with less than $100k, 31% (27%) with $101k-$500k, and 34% (42%) with more than $500k.
c) 37% (34%) expect live on less than $2000 per month, 33% (27%) on $2001-$3000, 19% (19%) on $3001-$5000, 7% (12%) on $5001-$7k, and 4% (8%) over $7k.
d) 42% (34%) of them plan to work ZERO hours after retirement, but 40% (45%) expect to work over 10 hours per week.
e) 28% (38%) are 31-45, 29% (28%) are 46-55, and 43% (34%) are 56-65.
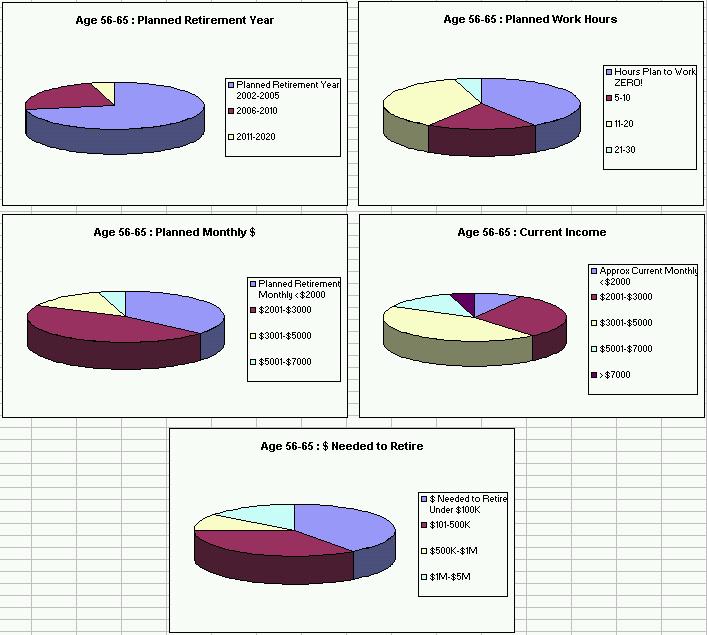
f) In the 56-65 age group, 40% (31%) plan to retire with less than $100K and 35% (27%) with $101k-$500k; 41% (34%) plan to work ZERO hours per week, 18% (21%) plan 5-10 hours, and 41% (45%) plan 11 or more hours per week. Although one might expect correlation between those planning to retire with less and work more, that wasn't the case -- for example, 44% (50%) of those retiring with less than $100k also plan to work ZERO hours.
Bottom line conclusions, referring to a, b, c, and d above:
a) Most everybody plans to own their homes, rather than rent, and a majority of those answering this survey live or plan to live in RVs. This surprises me somewhat, since I assumed that most of my readers were house-bound. I think this calls for another mini-survey -- I really don't believe that this many of you are living in RVs. Maybe this represents the wishful thinking of those who responded to the survey, but haven't yet consulted with their spouses on this full-time RVing plan ... LOL. It may also have been that either you misunderstood the question or I misunderstood the answers. I'll set up a mini-survey on the home page and see if we can find out.
Mini-Survey Results (as of the publication of this book): Roughly 82% of the people visiting my website and taking the mini-survey are retiring to RV living, and more than half (62%) of those without a home base! These numbers will probably change over time as more people respond -- go to RetirementTips.com to see the current numbers.
b) Nearly half of current retirees had $101,000 to $500,000, but among those not yet retired, approximately 1/3 fall into each of the three ranges (less than $100k, $101k-$500k, and more than $500k). This would indicate that possibly some of those not yet retired are underestimating the amount they'll need and some are overly optimistic about the amount they'll have by the time they retire -- or maybe that's a reasonable distribution, since the answers on c roughly correspond. I also notice some differences between the 2002 responses (in parentheses) and the 2003 results -- in the retired group, the number retired with less than $100k declined and the number over $500k increased; in the not yet retired, however, just the opposite occurs, with the number planning for less than $100k increasing and the over $500k decreasing. This seems inconsistent, with retirees needing more and planners thinking they'll need less. The same paradox occurs on the c results, so I guess the planners are thinking of ways to live more frugally. Looking at e, note that the not yet retired respondees aged 31-45 decreased between the 2002 and 2003 responses, while the 55-65 increased. This would indicate to me that, as people get closer to retirement, they're reassessing their requirements downward. I recall that when I was planning, I was continously trying to determine the minimum that we could get by with, in order to retire as early as I desired.
c) In both retirees and those not yet retired, approximately 1/3 plan to live on less than $2000/month and 1/3 on $2001-$3000, but 11% of those not yet retired plan to spend over $5000/month. None of the current retirees are spending over $5000/month. One might conclude from this that some of the not yet retired are again overestimating the amount they'll have to spend. On the other hand, future inflation may well raise the amount required, so maybe those over-$5000 people are being a little more realistic.
d) While 84% of those currently retired don't work, it looks like roughly half of those not yet retired are planning to work. This would indicate to me that there are more thinking that the amount of money that they have will be insufficient to support them. Some might interpret this as people wanting to continue working to some extent into their retirement years, but I guess I just don't buy that. Hobbies are fine, but it's my opinion that most people really wouldn't work during retirement unless they had to. Maybe that's another mini-survey.
Mini-Survey Results (as of the publication of this book): Nearly half (47%) of those responding are working during retirement or planning to continue working to some degree, due to financial need. About 23% say the working is to stay active, 7% to pursue some life-long ambition, and 20% not working at all. These will change as more people respond -- go to RetirementTips.com to see the current numbers.
If I was planning to retire and considered myself about average (i.e., currently earning about $3000-$5000 per month), I'd say I should plan to own my home (an RV), have $100k to $500k when I retire, spend around $3000 per month, and work up to 20 hours per week ... assuming you believe my survey results.
Below are all the details, so you can draw your own conclusions about the results. Charts are grouped by Retired, Not Yet Retired, Age 31-45 Not Yet Retired, Age 46-55 Not Yet Retired, and Age 56-65 Not Yet Retired. If you spend time reviewing these and notice any significant trends that I've overlooked, I'd appreciate an email at rjhoffman@yahoo.com.
Results from Retired People
Results from Not Yet Retired People
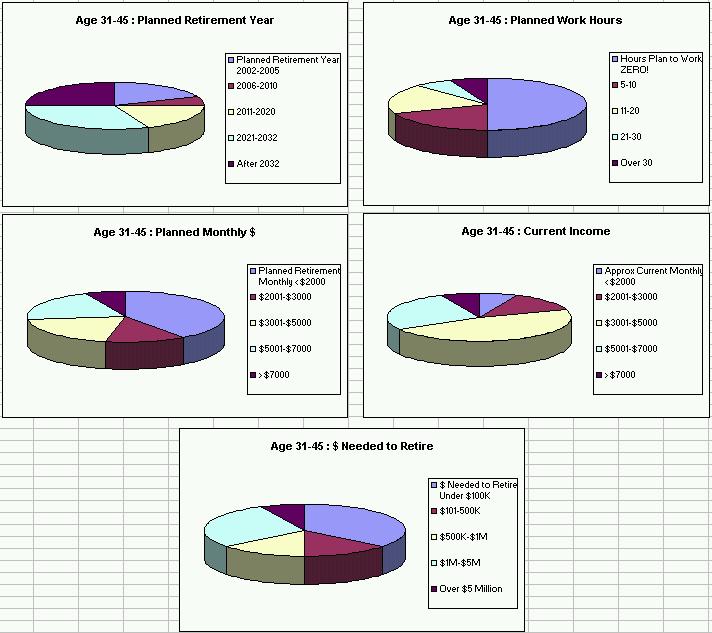
Results from Not Yet Retired People in the 31-45 Age Group
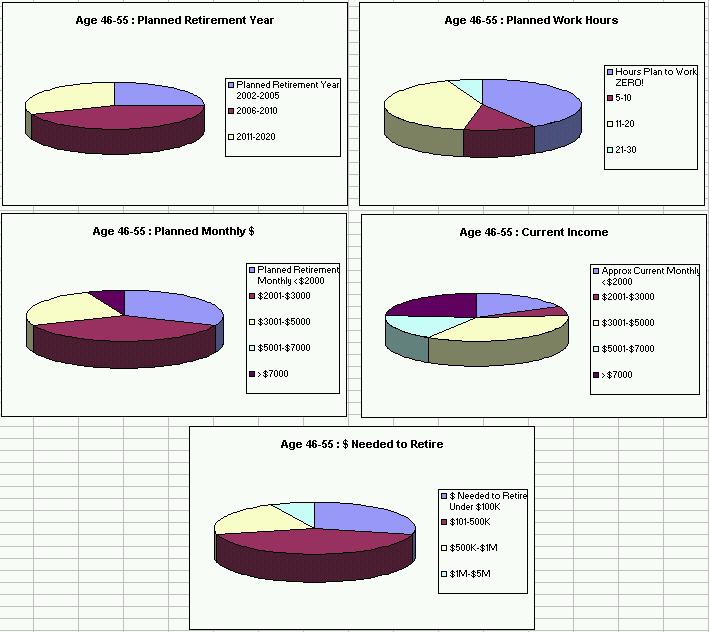
Results from Not Yet Retired People in the 46-55 Age Group
Results from Not Yet Retired People in the 56-65 Age Group